Insights from your Telraam data - a case study from Antwerp
Monitoring traffic during calming measures and road works • Written by Wouter Florizoone on 26 August 2022

For this data analysis and interpretation we used the newest Telraam dashboard feature, “street sheet”. We launched street sheet, which transforms all raw data into comprehensive and straightforward graphs, in June 2022 but made it available only for a select number of Telraam networks.
Kris, Telraam co-founder and traffic data lover, ran a data workshop. These workshops are opportunities for citizens and officials to sit together and explore the results for their village or city, facilitated by a Telraam data expert.
Ranst is a municipality in the Belgian province of Antwerp with a population of approximately 20 000 people. The Schawijkstraat in Ranst is a local residential street, and the main function of this road is to serve local residents. The speed limit is 50km/h (30 mph) and it has typical traffic of about 100 to 150 vehicles per hour. Imagine one vehicle passing every thirty seconds.
When starting the data analysis, the first thing to do is to determine the periods you want to compare. Reasons to compare could be, for example, wanting to know the impact of road works, of a new cycling path, of a new speed limit in the street or wanting to know the impact of school holidays on the traffic in a certain area. It is important, therefore, to have a baseline as well as a period to review.
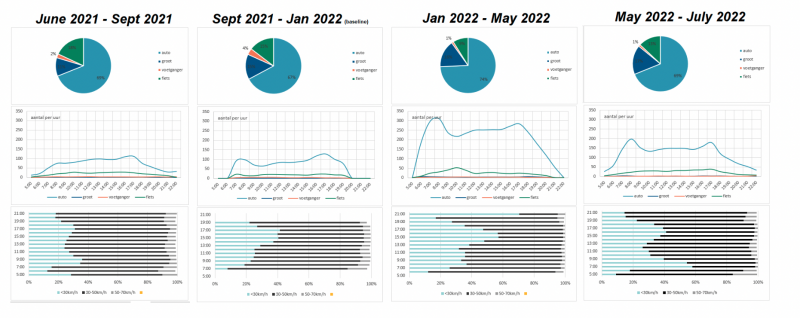
For our example in Ranst, we defined four periods of several months:
The first period was from June 2021 to mid September 2021. This was during summer holidays and traffic volumes weren’t representative for the rest of the year. However, on the f 16th of September an obstacle was placed about 20m from the counting location to reduce the speed of passing traffic. This didn’t impact traffic volumes, but is relevant in order to compare the speed in each period.
The second period ran from September 2021 to January 2022, a long period which serves as a baseline for traffic volumes.
The third period ran from January 2022 to May 2022, and was selected because there were extensive roadworks on a nearby main road, and the Schawijstraat was on the main diversion route for traffic heading to the city of Antwerp.
The fourth period ran from May 2022 to July 2022, when roadworks had been completed and we’d expect to see traffic return to normal patterns.
From the Telraam raw data, we derived a traffic profile of a typical day for these four periods:
Click here to see the images in larger format.
At first glance, the traffic profile of this road is normal: a short, sharp morning peak at about 8am, and a more lengthy evening peak between 4pm and 7pm. Most street segments we measure show a similar pattern of traffic. What is immediately apparent is that the traffic volume trebled during the roadworks on the main road (period 3), particularly during the morning peak. When the main road was reopened, from May onwards (period 4), we see traffic dropping to lower levels, but not quite as low as it was before the roadworks started (period 2). Morning and evening peaks are still more pronounced, suggesting that this road is still being used to avoid the main road during rush hours.
It is also interesting to explore whether speed calming measures had any effect. To do this we explored the weekday V85 for each of the periods, overlayed in a single graph.
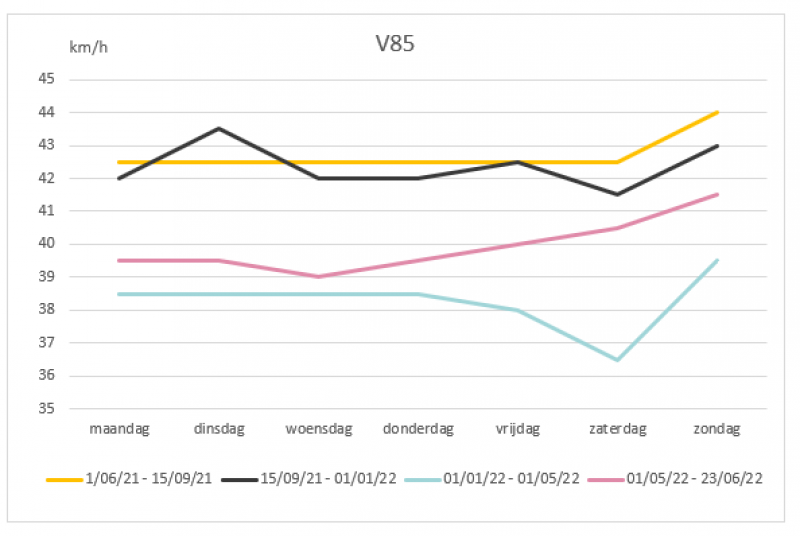
For the first period (June to September) the V85 is about 42-43 km/h with little variation over the days of the week. Not too bad for a street with a 50km/h speed limit.
During the second period (September to January), the speed was marginally reduced on all days except Tuesday. The change is likely not significant and within the margins of error of the sensor. So, in this particular case, the Telraam-device was too far away from the site to observe any effect of the speed calming intervention.
During the third period (January - May) we already know that the diversion led to an increase in traffic . We see the V85 drops about 4-5km/h, to 38km/h. The drop is consistent for every day of the week, evidence that the change is significant and systematic. Increased traffic leading to some congestion can explain the drop in speed.
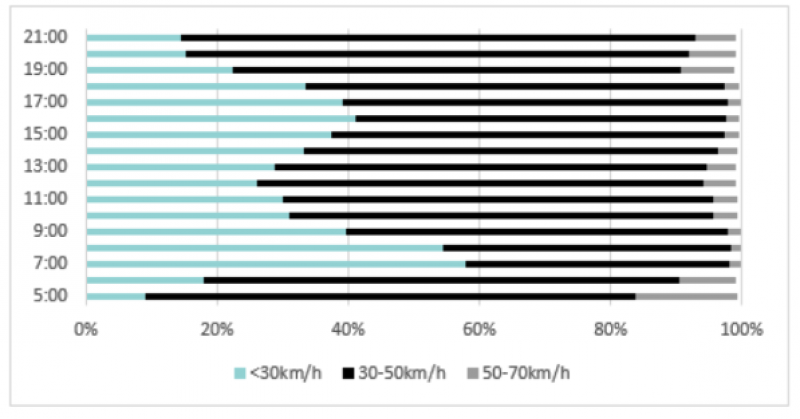
Traffic volume and traffic speed are inversely proportional, i.e. when traffic volume is high, average speed is low and vice versa. You can also see this by looking at the speeds per time of day. Below are the speeds of cars, per speed-category, per hour of the day, for this road segment for the period May-July.
The share of cars driving 30km/h or lower is:
- highest in the morning and evening peak when traffic volume is highest,
- lower in between the peaks and
- lowest very early in the morning or late in the evening when traffic is lowest.
Fewer cars basically means more road space to drive faster.
In the fourth period (May-July ‘22) we see that traffic decreases again, but although the diversion had been lifted, traffic volume didn’t (immediately) reduce to the levels seen prior to the diversion. Some additional traffic remained. This is also reflected in the V85 speed increasing again, though not to baseline (period 2) levels. This likely reflects changing habits of commuters and it will be interesting to see if traffic levels eventually return to the level seen before the road works. Continued monitoring with Telraam will be useful!
Transparency is important for us, so if you are interested in this analysis, you not only get graphs, but also the source data. For the Schawijkstraat, the file with all the data can be found here. During the local workshop we not only analysed the Schawijkstraat, but also other interesting cases using the new “street sheet” functionality. If you would like to explore these other examples, we invite you to explore the full list here.
If you want to enable this new functionality for your Telraam network, reach out to us! Be aware this feature is only available to network administrators and is still under development.
To conclude, this case study demonstrates that when monitoring traffic over a long period of time with Telraam, it is possible to objectively reveal the impact of interventions in a fine grained road network, be it on traffic volumes or speed.